

Maps
Spatial and Temporal Analysis of Application Efficiency for the State of California
![]()

![]()
![]()
This webpage provides a series of maps, by hydrologic region, for an overall irrigation efficiency estimated for the whole region, as well as for 20 different crops for 2 years, 2001 and 2010.
Overall Irrigation Efficiency estimated by region:
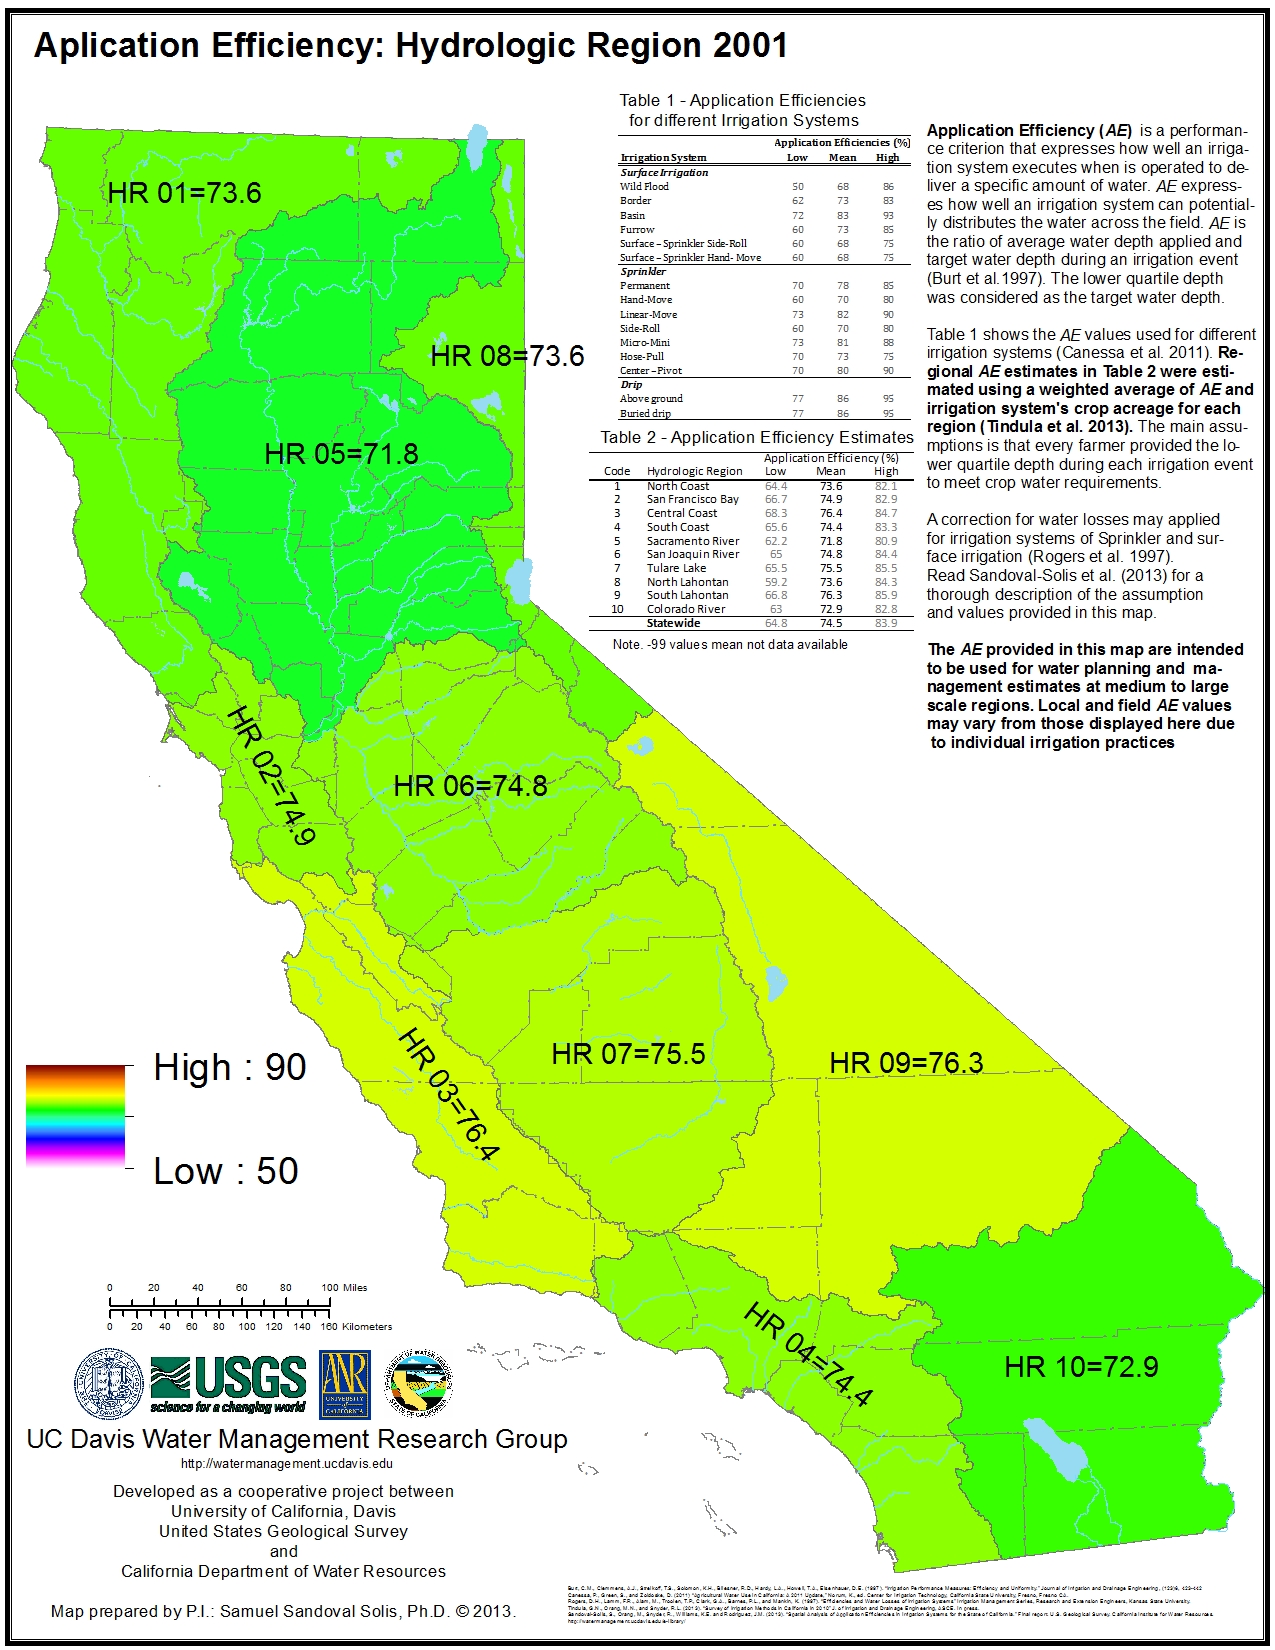
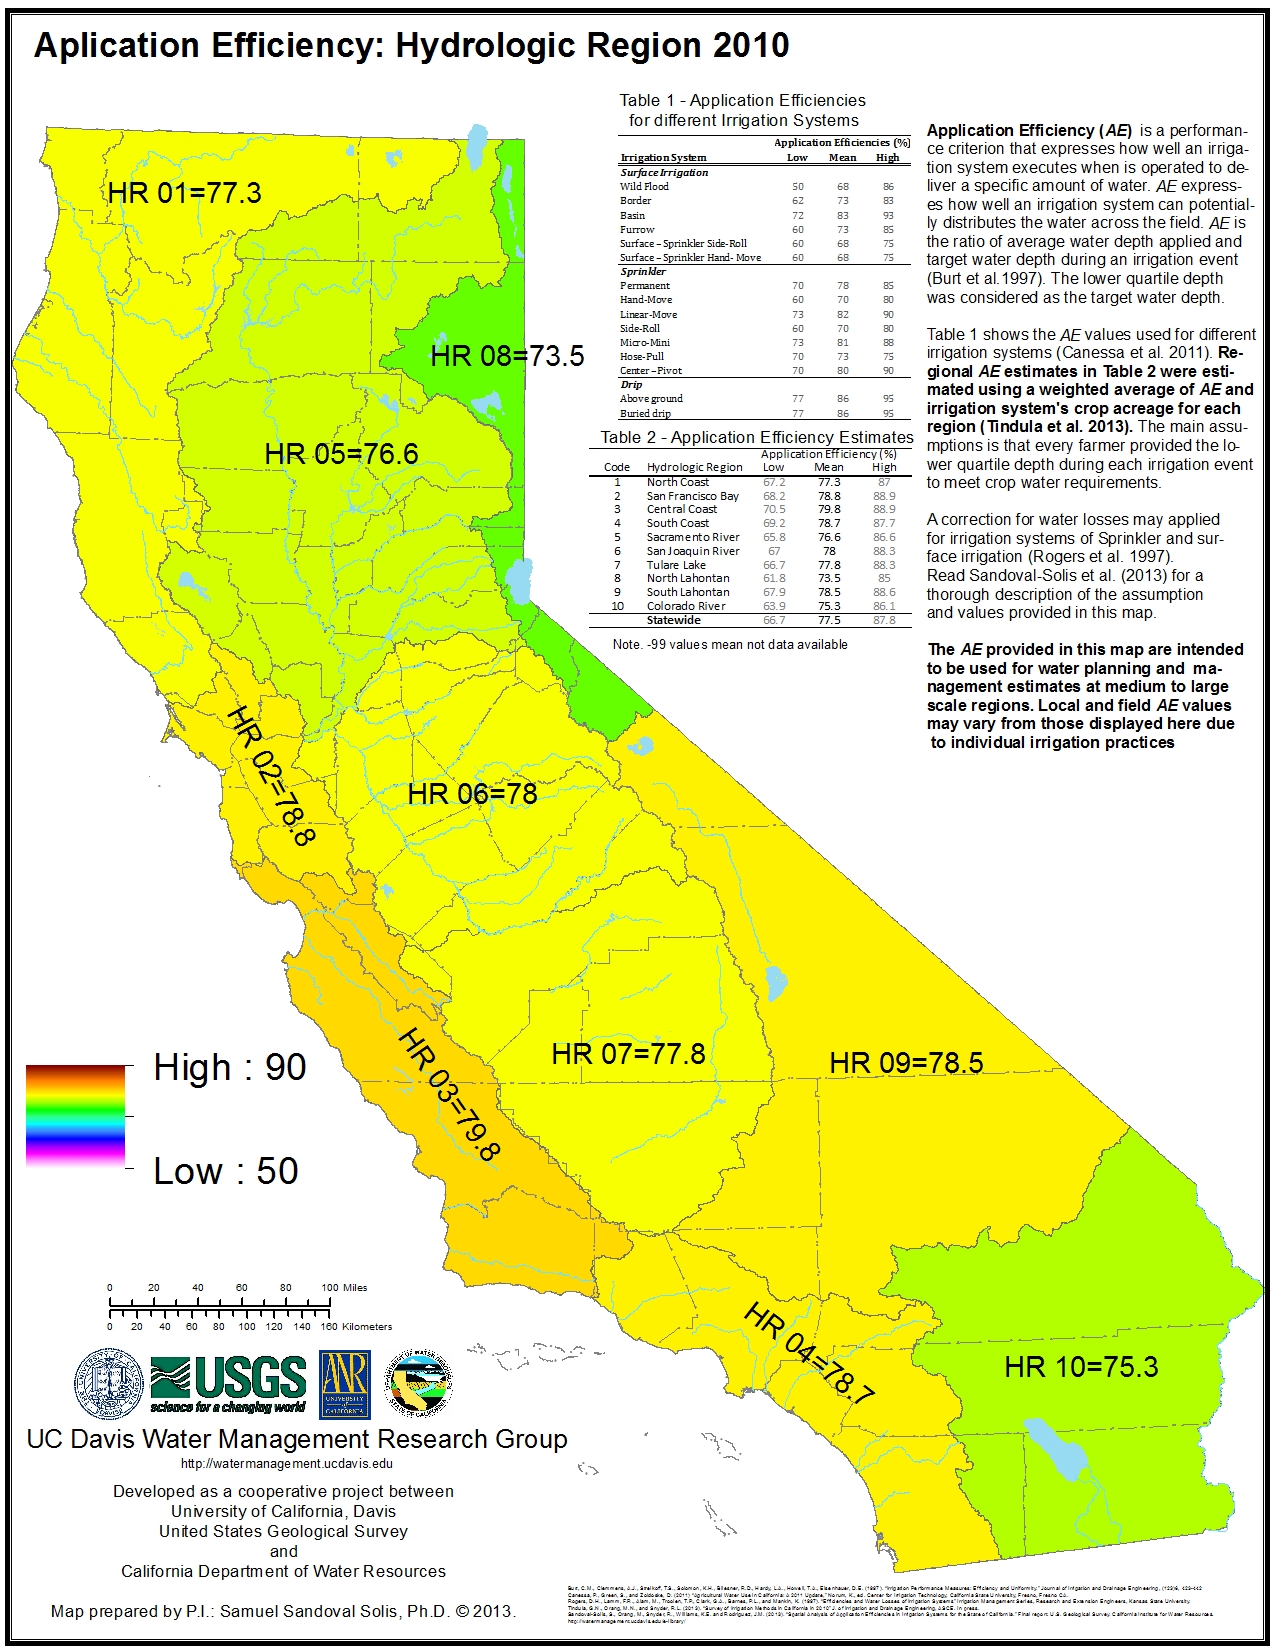
2001 2010
The following table provide the statewide Application Efficiencies:
| 2001 | 2010 | |||
| Statewide | .mdb | .mdb | ||
Estimated Irrigation Efficiencies for 20 different crops
| Crop | 2001 | 2010 | ||
| Corn | .mdb | .mdb | ||
| Cotton | .mdb | .pdf |
.mdb | |
| Dry Beans | .mdb | .mdb | ||
| Grains1 | .mdb | .mdb | ||
| Safflower | .mdb | .mdb | ||
| Sugarbeet | .mdb | .mdb | ||
| Other Field Crops2 | .mdb | .mdb | ||
| Alfalfa | .mdb | .mdb | ||
| Pasture3 | .pdf |
.mdb | .mdb | |
| Cucurbits4 | .mdb | .mdb | ||
| Onion and Garlic | .mdb | .mdb | ||
| Potato | .mdb | .mdb | ||
| Tomato - Fresh | .mdb | .mdb | ||
| Tomato - Processing | .mdb | .mdb | ||
| Other Truck Crops5 | .mdb | .mdb | ||
| Almond and Pistachio | .mdb | .mdb | ||
| Other Deciduous6 | .mdb | .mdb | ||
| Subtropical Trees7 | .mdb | .mdb | ||
| Turfgrass and Landscape | .mdb | .mdb | ||
| Vineyard | .mdb | .mdb | ||
| Notes: |
||||
| 1.- wheat, oats, barley, etc. | ||||
| 2.- sorghum, sunflower, sudangrass, etc. | ||||
| 3.- excluding grass hay | ||||
| 4.- melons, squash, cucumbers, etc. | ||||
| 5.- carrots, celery, cauliflower, broccoli, strawberries, asparagus, etc. | ||||
| 6.- apples, peaches, prunes, pears, etc. | ||||
| 7.- olives, avocados, citrus, dates, etc. | ||||


